Highlights
Where a city puts its bus stops decides how far people walk, how much of the network they can actually use, and how much the operator spends. This research tackles that as a multi-objective optimization problem and answers it with an evolutionary algorithm, instead of collapsing everything into one score.
It started as the final project of the Evolutionary Algorithms course at the Universidad de la República (Uruguay) and grew into a paper with Sergio Nesmachnow (UdelaR) and Diego Rossit (Universidad Nacional del Sur, Argentina). It was presented at the Ibero-American Congress on Smart Cities (ICSC CITIES 2025) in Puebla, Mexico, and an extended version was published in Frontiers in Future Transportation.
The problem
Each census segment can get no stop or one of three stop qualities (basic, simple shelter, double shelter). Three goals pull against each other:
- Maximize coverage: the demand-weighted number of trips whose origin and destination are both within reach of a stop.
- Minimize the number of stops: a proxy for bus dwell time, and therefore travel time.
- Minimize cost: installation cost by stop type, weighted by local demand so that building in low-demand areas is penalized.
Adding stops raises coverage but also cost and travel time, so there is no single best answer. That is why the output is a Pareto front.
The fitness function
The model is defined over the set of census segments, which double as candidate stop locations, and the set of stop types (none, basic, simple shelter, double shelter). The decision variable is 1 when segment s gets a stop of type t, and is 1 when s is covered, meaning at least one stop exists inside its coverage neighborhood . A trip counts as covered only if both its origin and destination are covered.
Three objectives
This is the fitness vector the multi-objective algorithm evaluates directly, with no weights:
- Coverage sums the trips in both directions between every pair of covered segments.
- Stops counts the installed stops.
- Cost adds the cost of each installed stop, scaled by how busy its segment is relative to the busiest pair in the city, , defined as:
Constraints
Each segment gets exactly one stop type (type 0 means no stop). A segment is covered if and only if some segment in its neighborhood has a stop of type 1 to 3. All variables are binary.
Normalized fitness for the single-objective baselines
The single-objective GA and the local search need one number to compare solutions. Each objective is rescaled to and then combined with weights. Coverage is divided by its theoretical maximum (the sum of all demand):
The stop count is normalized by the number of segments:
Cost is normalized between its minimum and maximum achievable values . The bracketed demand factor in ci runs from in the highest-demand segments (building there is rewarded) to in the lowest-demand ones (building there is penalized):
The final fitness is the weighted sum:
The weights were set with a grid search over five candidate values per weight, 125 combinations in total, favoring coverage while still pushing toward cheaper, better-placed stops. The multi-objective algorithm skips this step entirely, which is why it can return the whole trade-off curve instead of one weighting of it.
How it works
The solver is a customized NSGA-II on top of jMetal. The operators are tailored to the stop-type encoding: two-point crossover, an integer mutation that prefers moving a gene to an adjacent stop type, and an initialization that favors empty segments with a few high-quality stops as seeds. Coverage masks are precomputed per candidate and updated incrementally, which is what keeps city-scale evaluation fast.
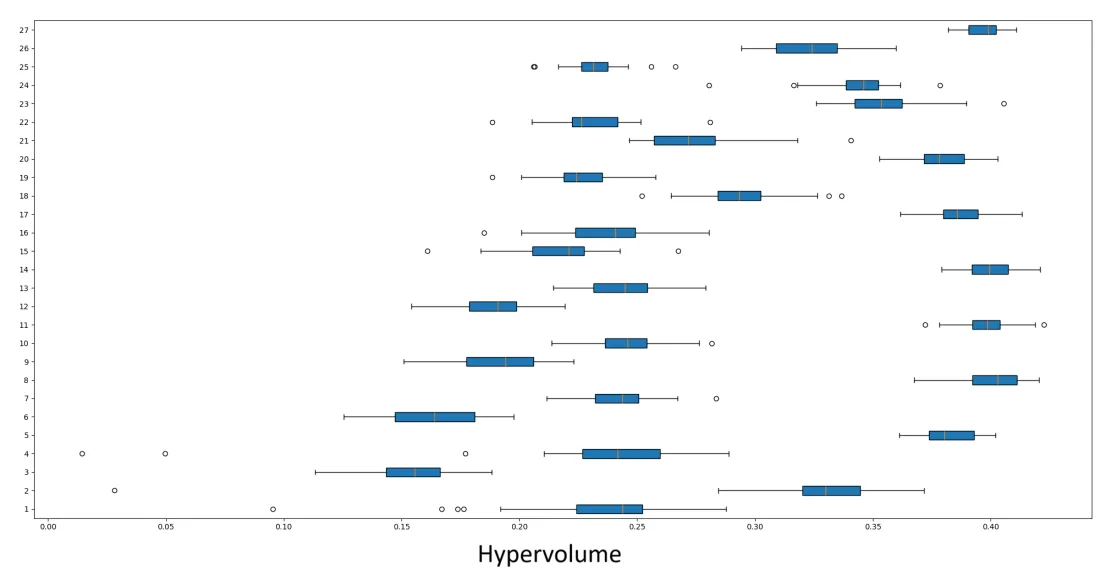
Parameters were tuned on a separate instance (Pittsburgh, 4,100 candidate locations) so the evaluation cities stayed unseen. All 27 combinations of population size, crossover and mutation probability were run 30 times each and compared with ANOVA on relative hypervolume. The winner (population 200, crossover 0.8, mutation 0.1) was used for every experiment.
Results
A far better Pareto front than a single-objective GA
The baseline is a single-objective GA with the same operators and weighted-sum fitness, tuned with a 125-combination grid search over the weights. Metrics are computed against a reference front built from 30 independent runs.
| Montevideo | MOEA | GA |
|---|---|---|
| Pareto-optimal solutions (higher is better) | 208 | 18 |
| Error ratio (lower is better) | 0.000 | 0.640 |
| Generational distance (lower is better) | 0.000 | 0.036 |
| Spread (lower is better) | 0.239 | 0.714 |
| Relative hypervolume (higher is better) | 0.992 | 0.209 |
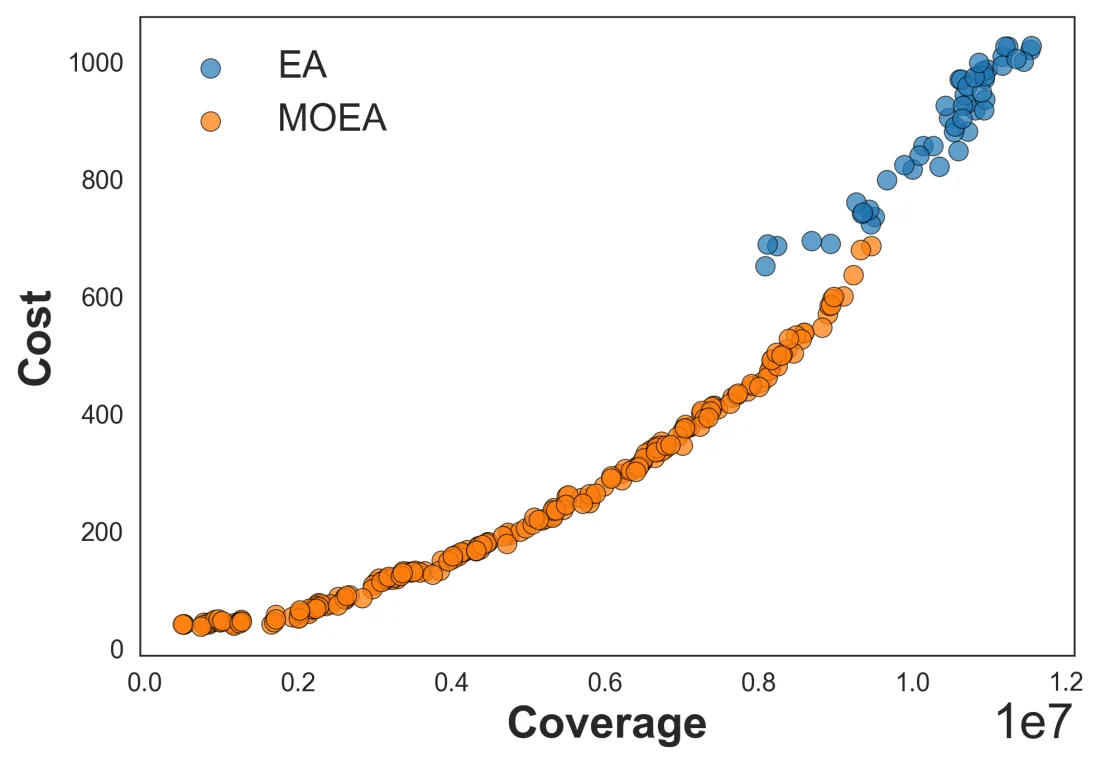
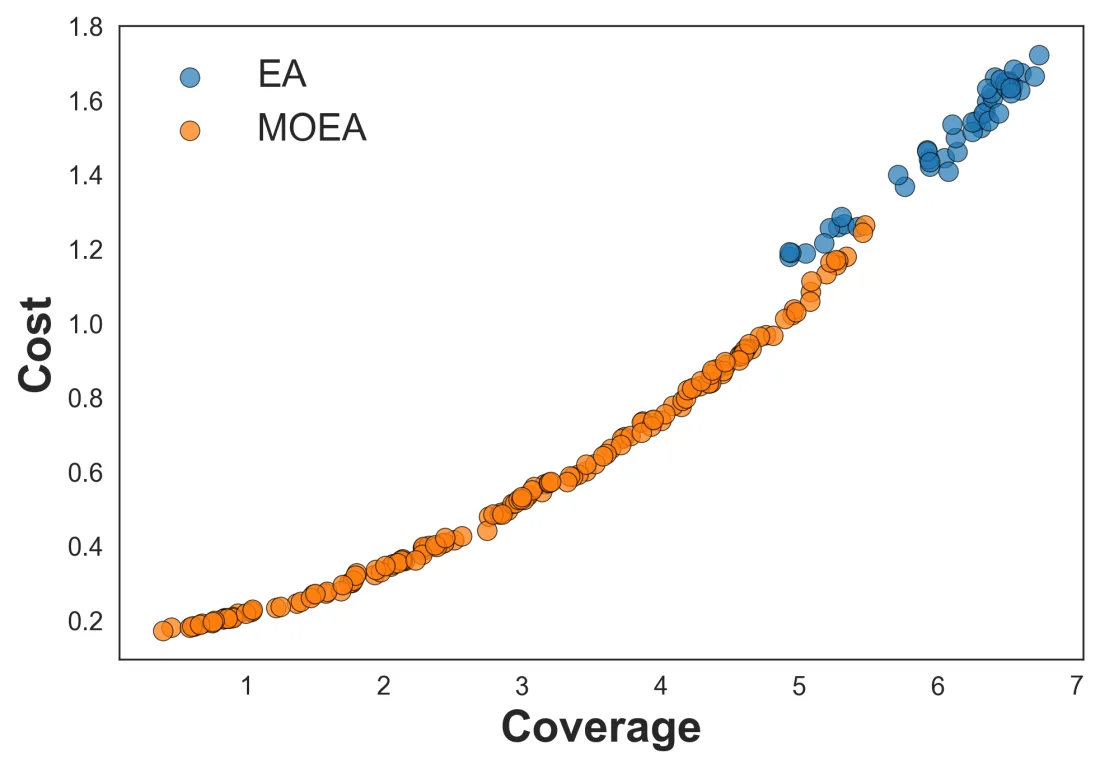
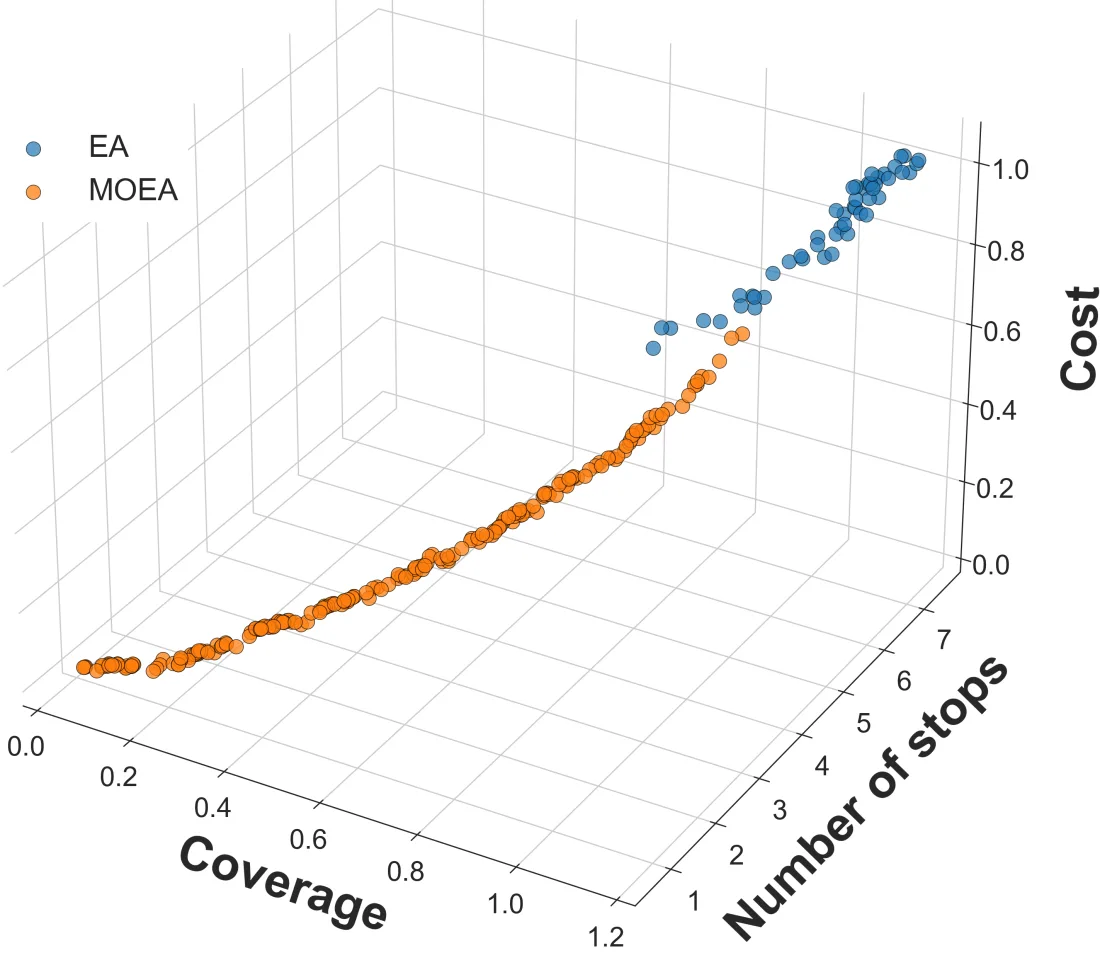
Buenos Aires shows the same pattern (relative hypervolume 0.990 vs 0.178). The plot below shows why: the single-objective GA only samples the expensive, high-coverage corner, while the MOEA covers the whole trade-off curve and dominates the GA wherever the two overlap.
A more cost-effective compromise than local search
Taking the compromise solution from each method, and using coverage per unit of cost as a common yardstick:
| Method | Stops | Cost | Coverage / cost |
|---|---|---|---|
| MOEA (compromise) | 317 | 248 | 23,352 |
| Single-objective GA | 527 | 652 | 12,395 |
| Local search | 987 | 733 | 16,677 |
Local search covers the most trips in absolute terms, but only by putting a stop in every one of the 987 segments. The MOEA compromise uses 68% fewer stops and about 66% less cost, and improves the coverage-to-cost ratio by 46.9% over local search and 28.6% over the single-objective GA.
What the solutions look like on a map
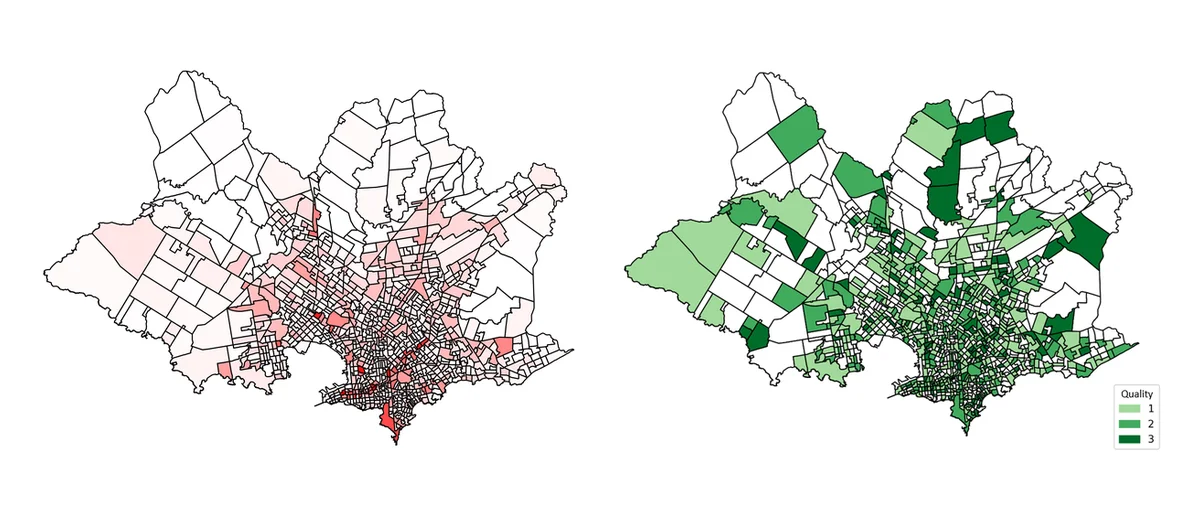
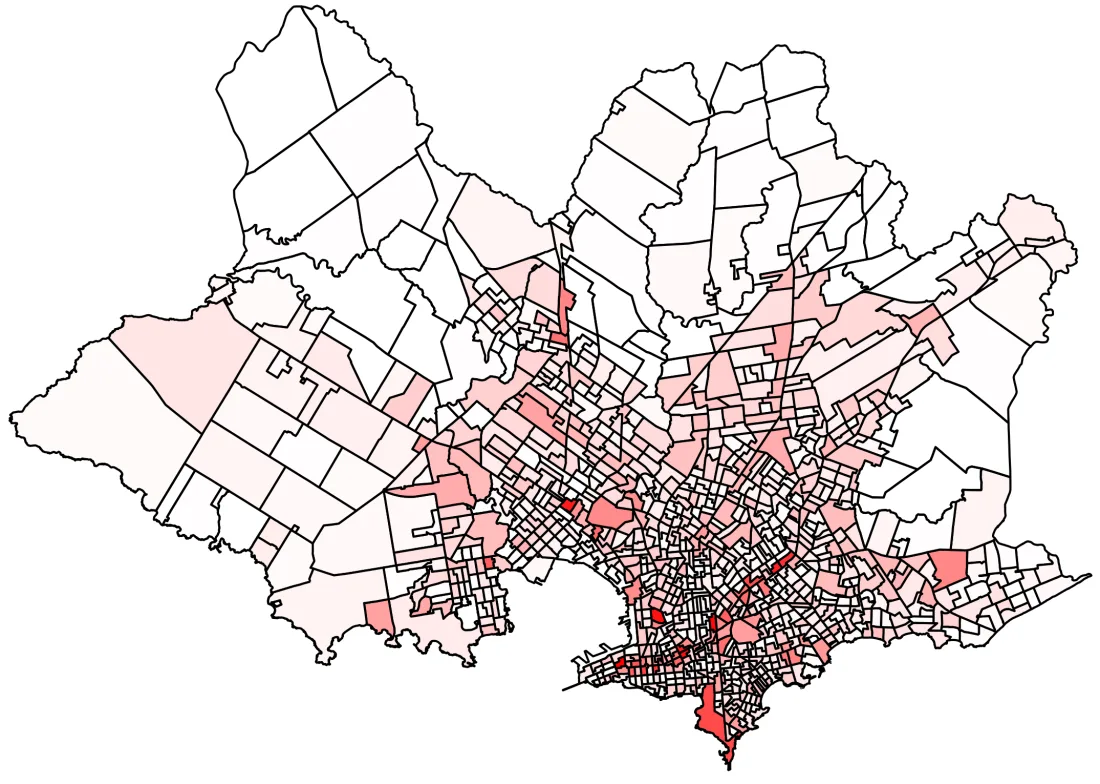
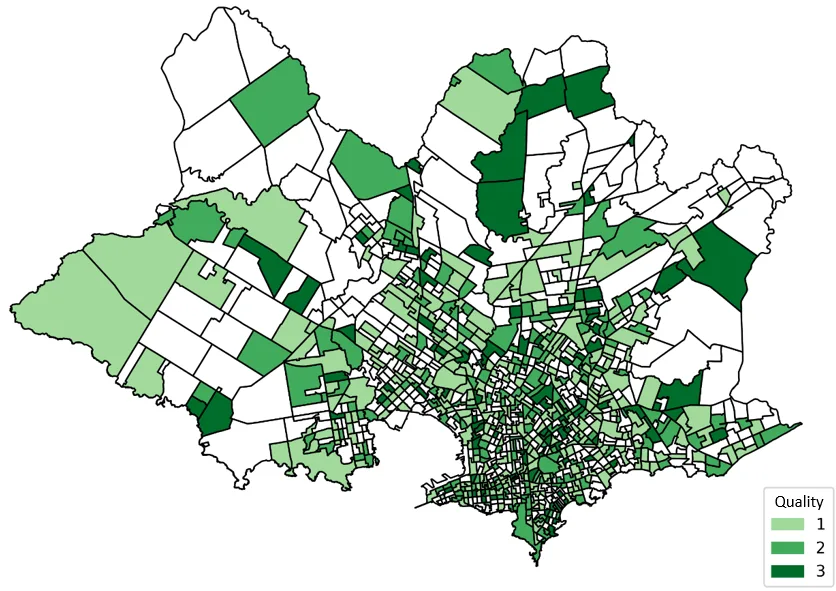
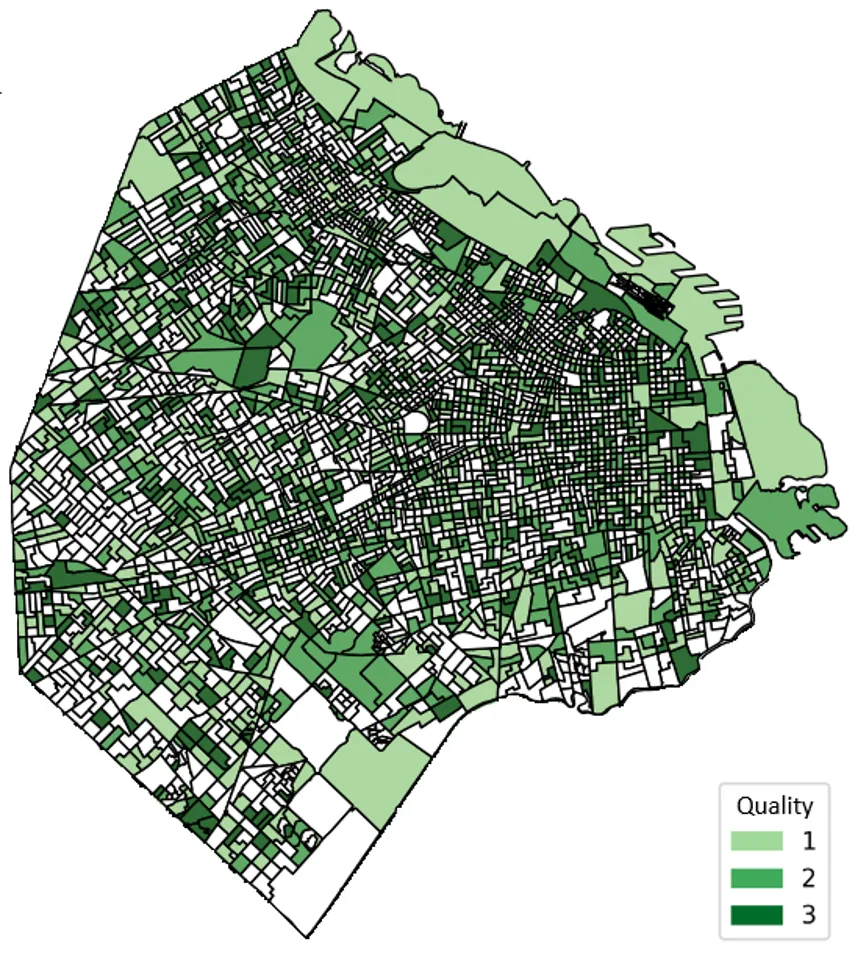
The compromise solution follows demand without being told where the city center is: premium stops cluster in the dense center and along main corridors, peripheral segments get lighter infrastructure, and low-demand segments are served by anchor stops in neighboring segments instead of getting their own. The result is a hierarchical, backbone-shaped network.
Takeaways for planners
- Hand over options, not a verdict: a Pareto set lets decision makers pick by budget, politics or service goals, and shows how much one objective costs in another.
- Equity needs explicit rules: cost-efficient solutions favor dense areas, so periphery protection should be added as a constraint or objective.
- Re-optimize as demand shifts: runs finish in under half an hour, which makes "what if" studies practical.
Future work covers demand uncertainty, equity indicators and budget constraints, and walking-distance and network-based coverage.
Resources
- Journal article, Frontiers in Future Transportation (2026): Read the paper.
- Repository: GitHub repo (Java, jMetal, Maven, with the plotting scripts).
- Certificate of participation, ICSC CITIES 2025: View certificate.